NICER / ISS Science Nugget
for March 7, 2024
Looking for "echoes" in NICER spectra
Many galaxies host supermassive black holes that are actively accreting matter, producing significant radiation across the electromagnetic spectrum. With different phenomena responsible for emission at different wavelengths, spectroscopic observations of these active galactic nuclei (AGN) probe the nature of accretion onto supermassive black holes and the role it plays in the formation and lives of galaxies. In "soft" X-rays (1-10 keV photon energies), AGN spectra are dominated by a broad continuum and a strong iron emission line. The continuum originates in the interaction of radiation from the accretion flow with a still-poorly-understood plasma-filled region called the corona; the result is an observed spectrum that follows a "power law" functional form. On top of this power-law continuum is the prominent emission line - at 6.4 keV - of iron atoms in an excited state.
These two spectral components arise from distinct physical processes, but their behaviors are nonetheless linked: because the power-law emission is what excites the iron atoms, we expect to see any variability in the brightness of the continuum reflected in the brightness of the line. Exactly how the line component responds or doesn't respond to changes in the continuum tells us about the size, extent, or geometry of the gas producing the iron line emission.
A paper by B. Gediman (Univ. of Michigan) and collaborators, recently accepted for peer-reviewed publication in The Astrophysical Journal, analyzed this relationship between the power-law continuum and iron line in the active galaxy NGC 4388, one of the brightest nearby galaxies in X-rays. The team used NICER to produce detailed spectra across many observations. The paper first investigates variations over a span of 4.5 years, thanks to two separate NICER campaigns, but it also looks at variations over a span of ~40 days from spectra obtained at approximately a daily cadence. Each observation was fit with a model to disentangle the emission line and power-law continuum contributions and examine their trends (light curves). The team then modeled these light curves to find a lag time between them; if the continuum flares or drops suddenly in flux, for example, seeing when the iron line responds to that change gives a rough indication of how far away the line-emitting gas is from the central black hole region. The team found a characteristic lag time of about 16 days, consistent with the time between a pair of particularly sharp drops in continuum flux and emission-line flux. The measurement of such lags raises the intriguing possibility that mass estimates for black holes like NGC 4388, in which the central accreting regions are obscured and inaccessible to other techniques, may be within reach of X-ray "echo-" or reverberation-mapping techniques. Additional NICER observations over long time intervals will provide a fuller picture of the relationship between continuum and iron-line emission.
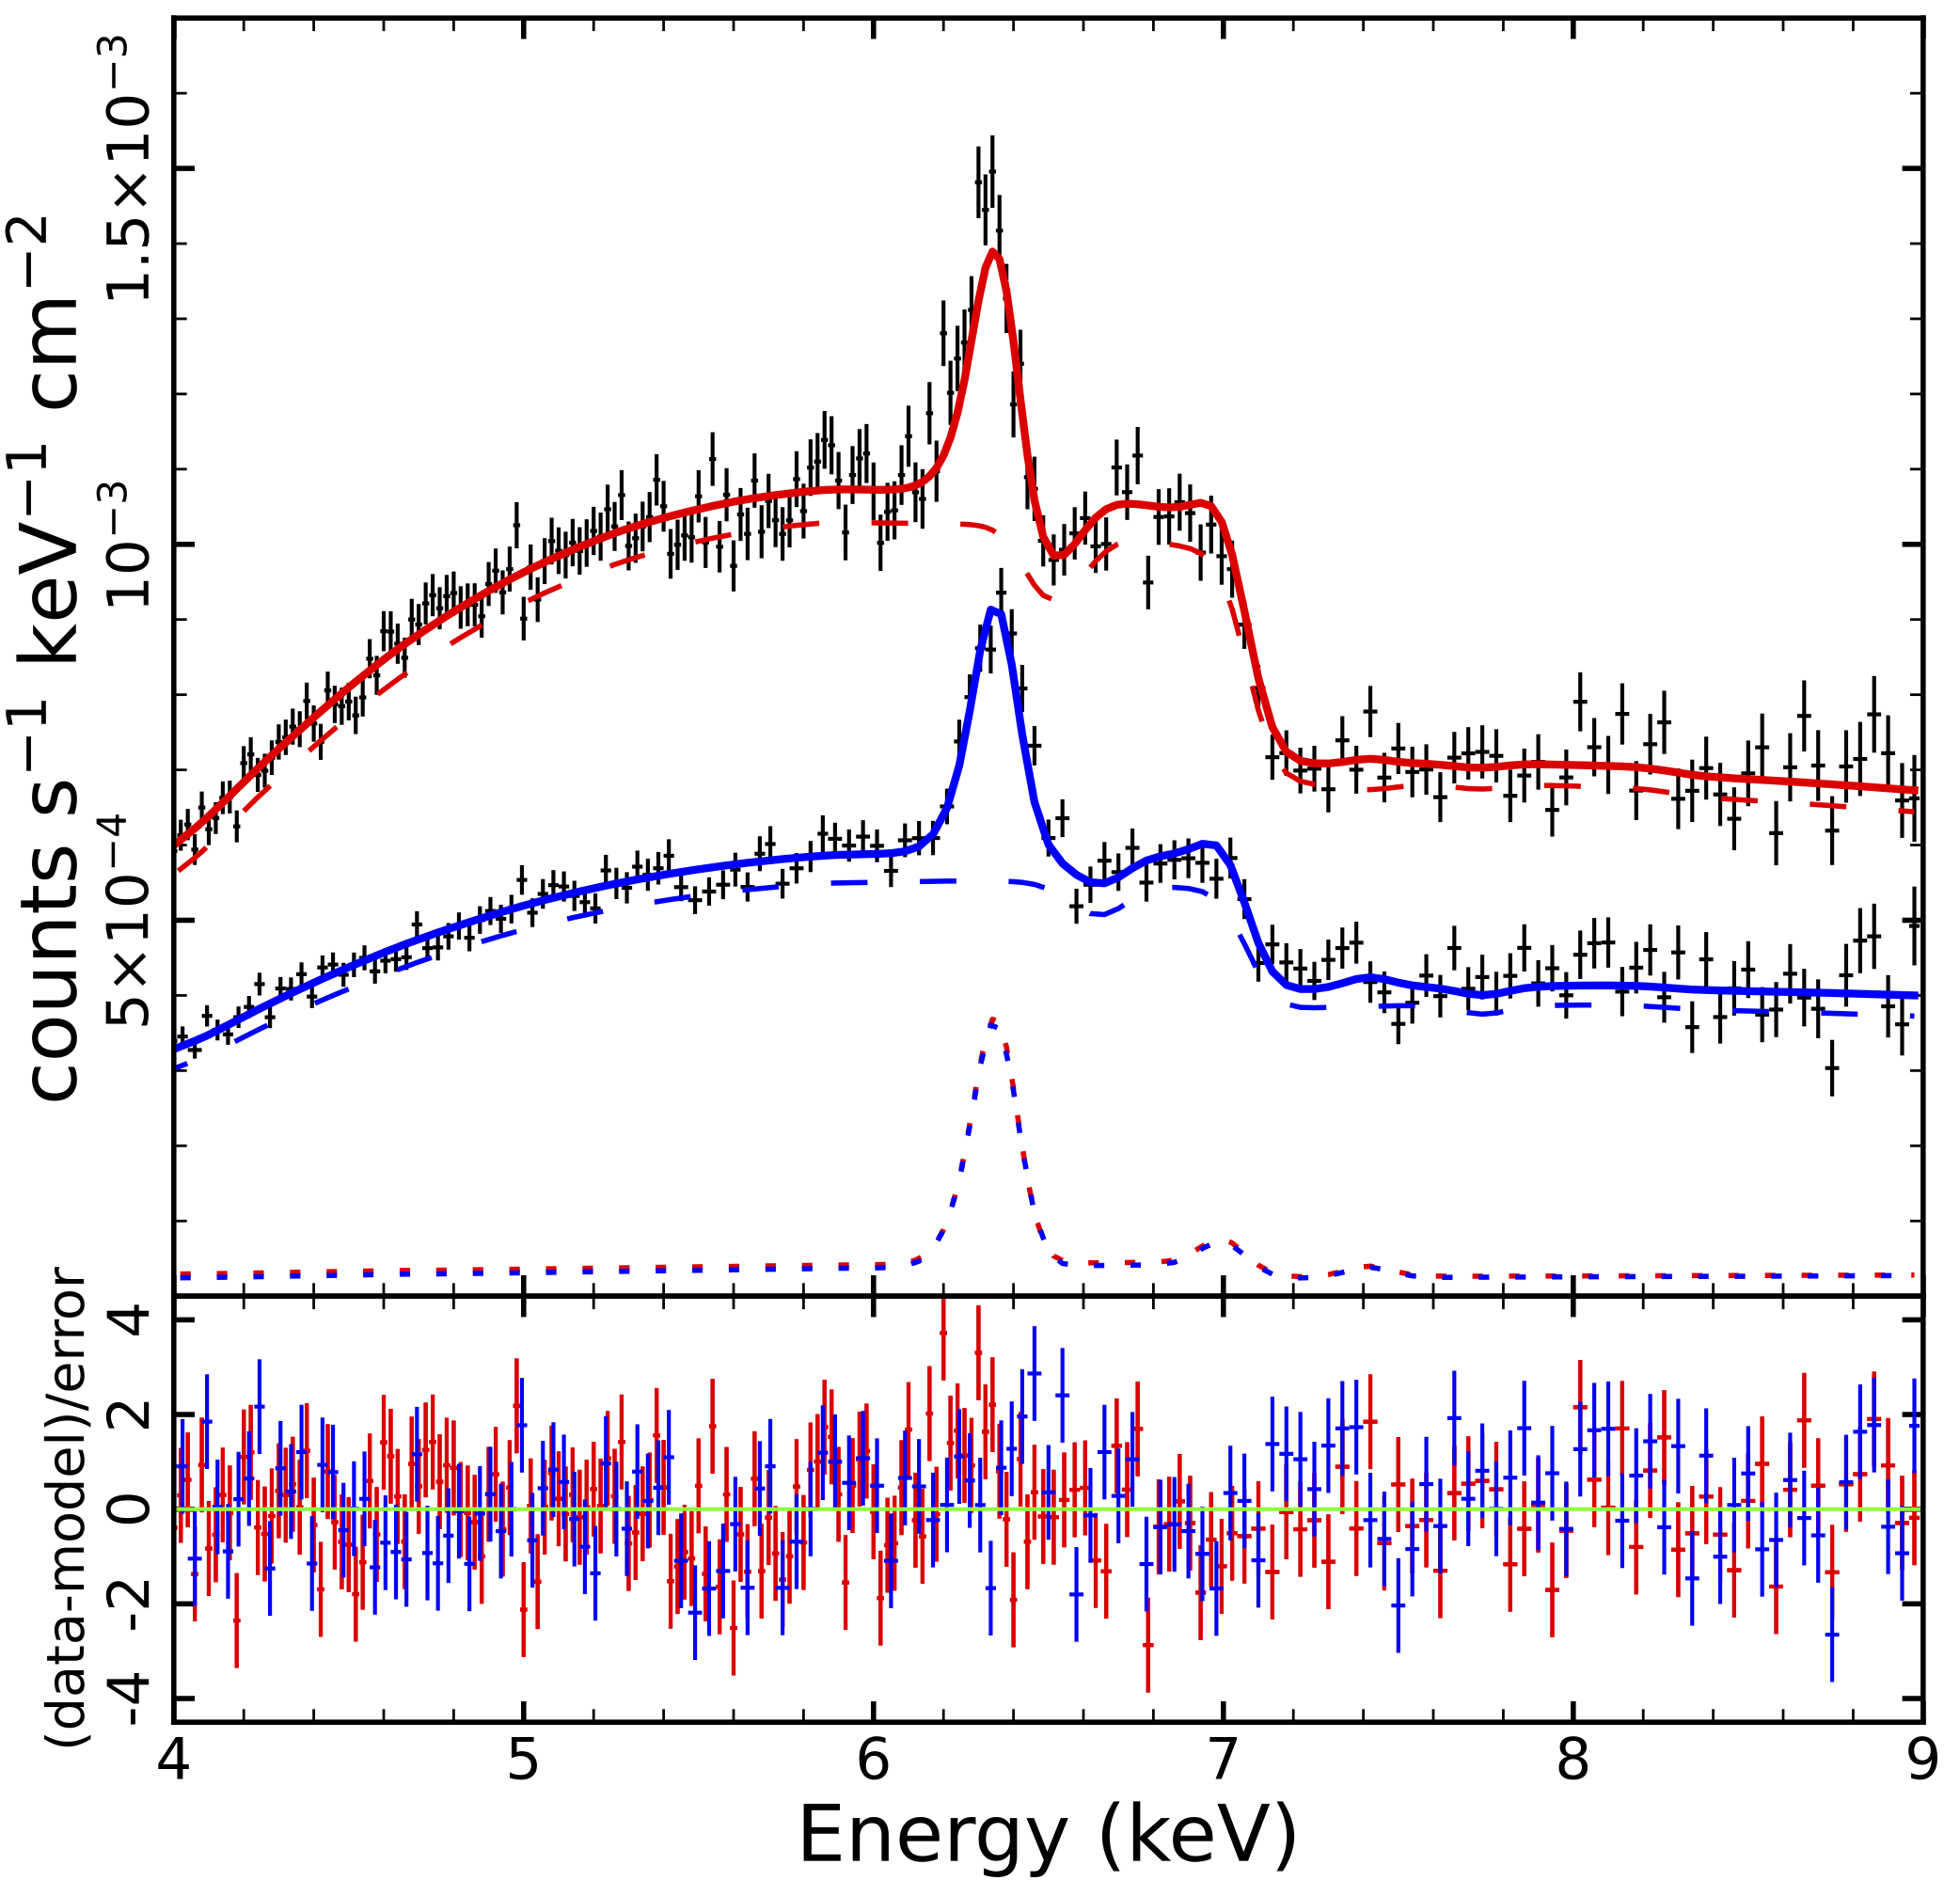
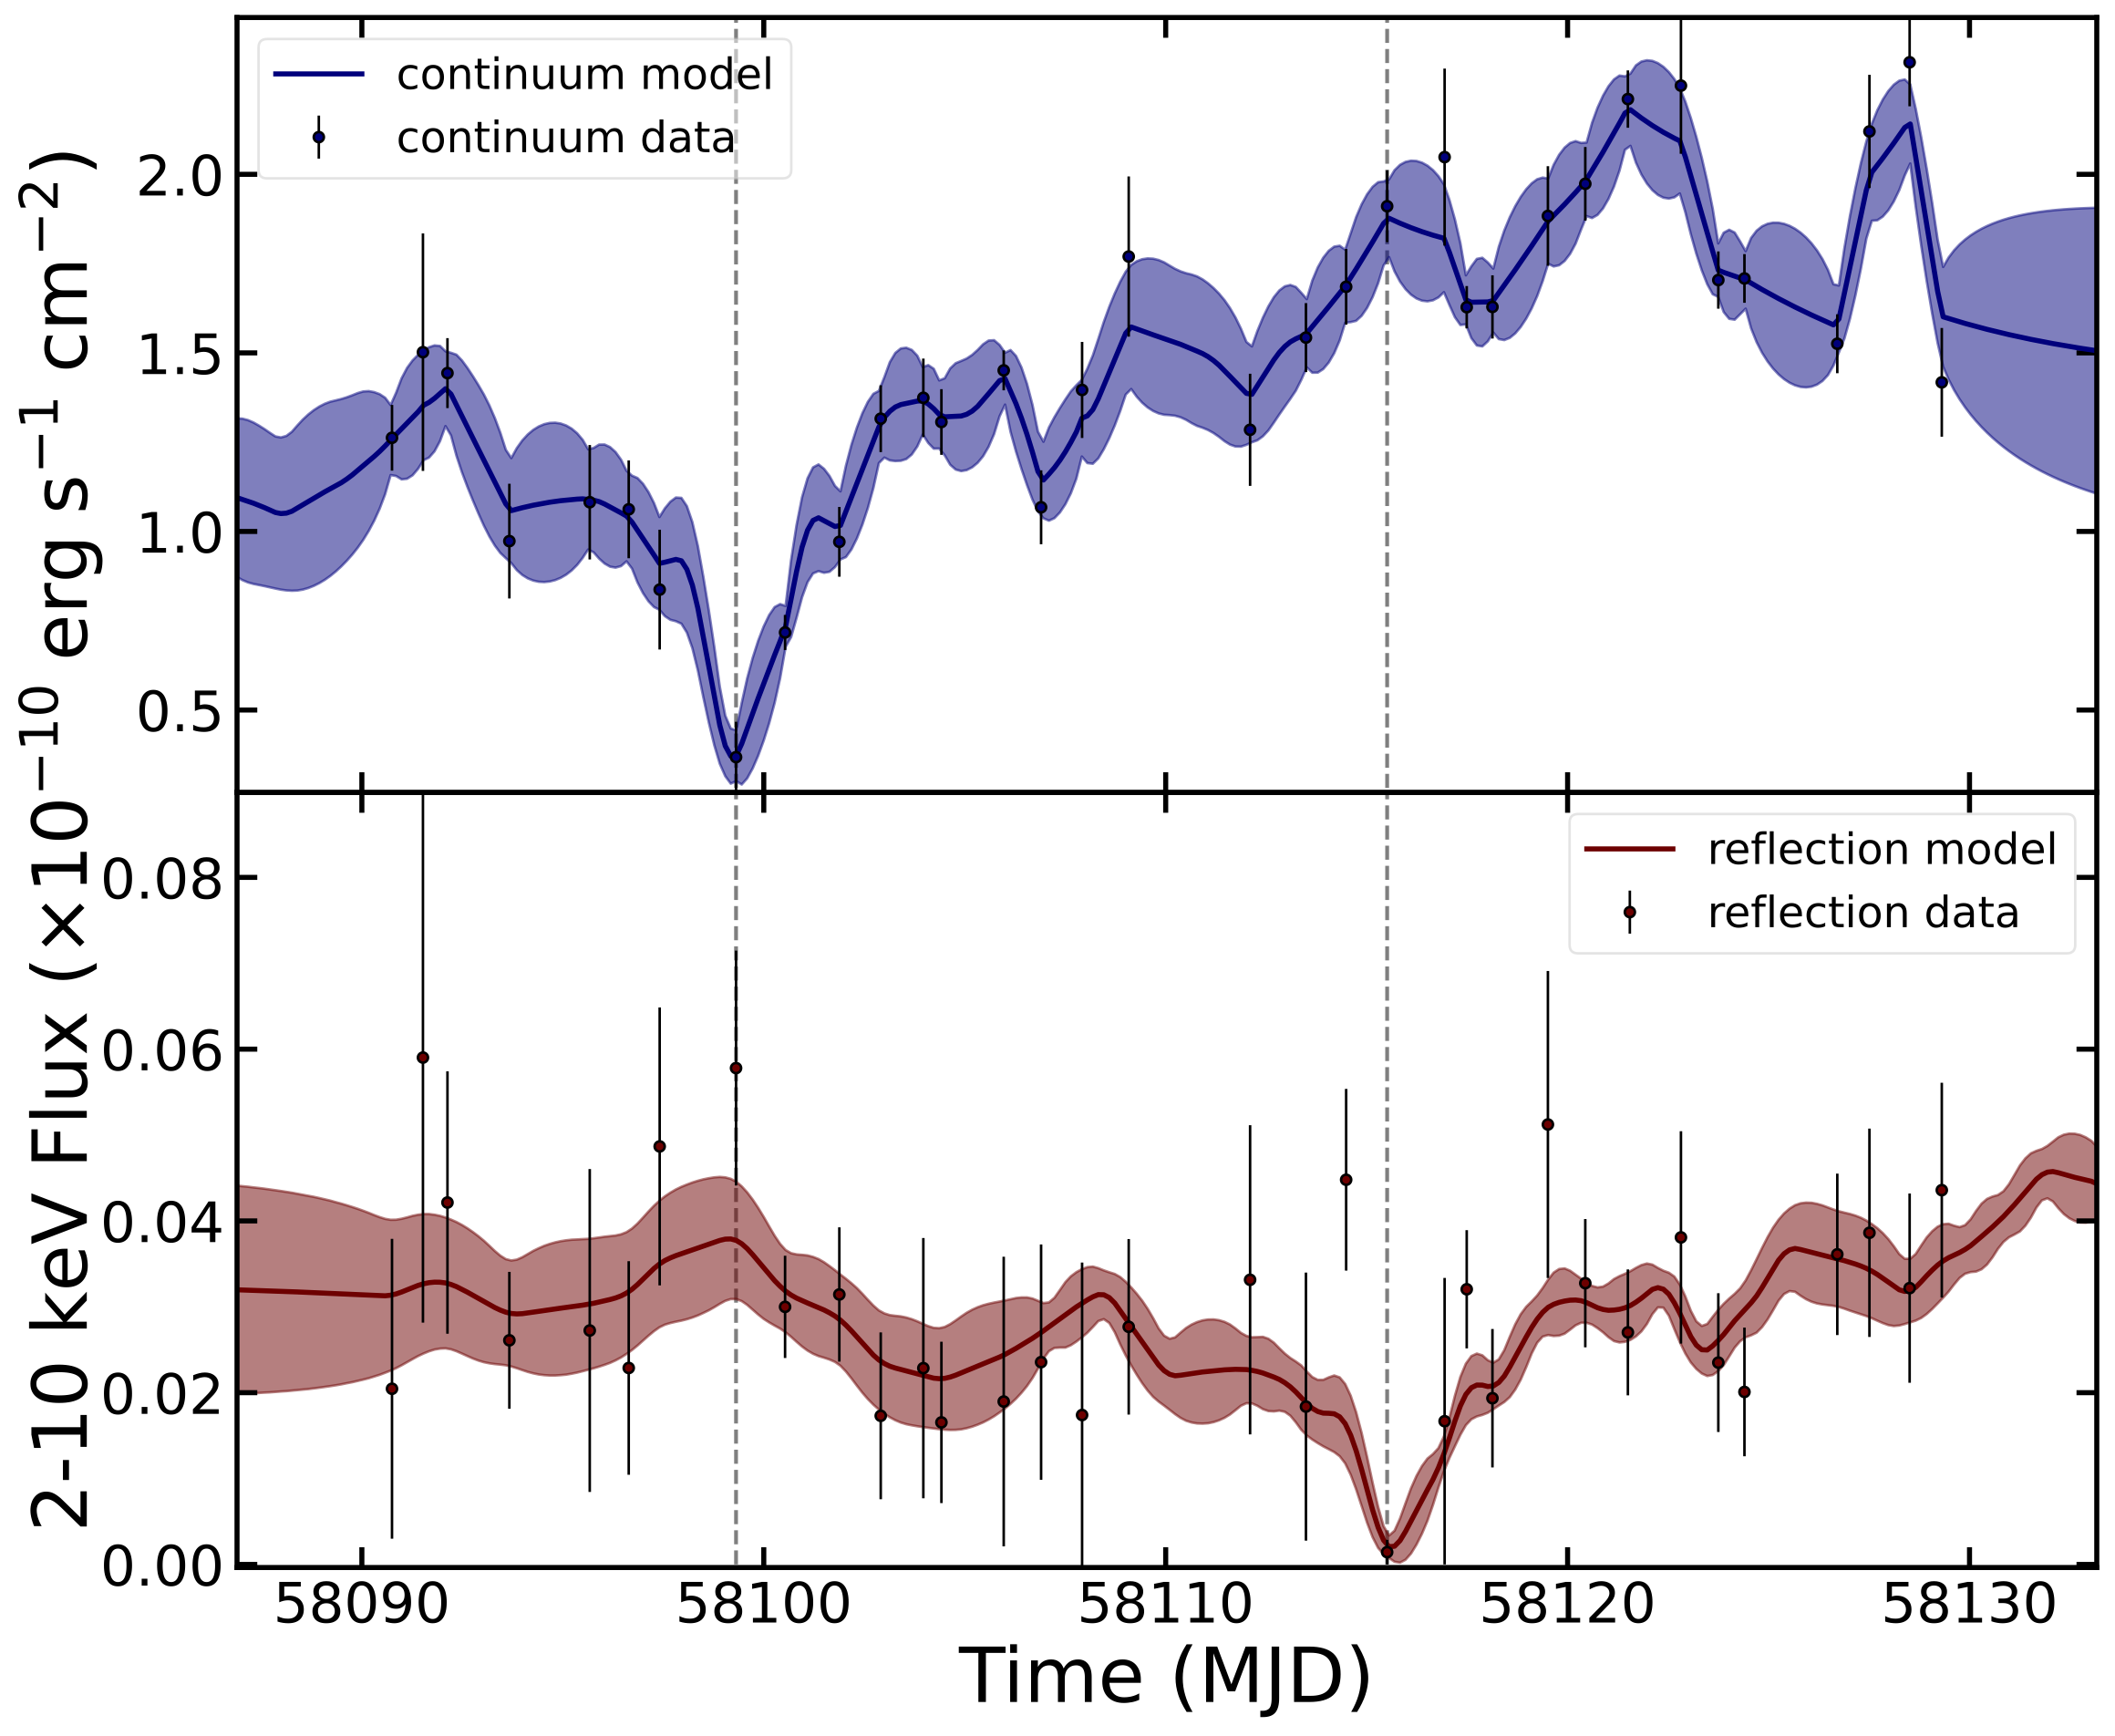
Left: Time-averaged X-ray spectra of NGC 4388 from NICER (black points), together with best-fit models (solid traces), for the 2017-18 (red) and 2022 (blue) observing campaigns. The differences between the spectra demonstrate the variability of the power-law continuum (dashed traces) and the strong iron emission line (dotted traces) at 6.4 keV. The lower panel shows the data-minus-model residuals. (Credit: B. Gediman et al. 2024). Right: Light curves of the power-law continuum and emission-line (or reflection) components, as calculated using the best-fit models to spectra of all individual observations. The blue and red solid curves represent a fit to the light curve data, which models how the flux of each component varies over time. The dashed gray lines highlight the noticeable dips in both light curves, which suggest a lag or echo between continuum variability and emission line variability. (Credit: B. Gediman et al. 2024).
<< Previous
Main Index
Next >>

