NICER / ISS Science Nugget
for June 13, 2024
Escape from a giant star
Nearing the peak of its 11-year cycle, our Sun's recent activity has garnered headlines, from solar prominences visible during the April total eclipse, to coronal mass ejections (CMEs) that produced brilliant displays of aurorae. Flaring activity is known from many other stars as well, with some noteworthy objects exhibiting very frequent or especially energetic ("superflare") events. One of these is a K-type giant star in the binary system IM Pegasi, in a 24.6-day orbit with a Sun-like star, approximately 300 light-years away.
The study of stellar flares - how often they occur, and how much energy and radiation they launch into their surroundings - is important for assessing whether planets around other stars exist in an environment conducive to the formation and sustenance of life. In addition to X- and gamma-rays emitted during flares, especially harmful particle radiation can be carried outward by CMEs, outflows that begin as prominence eruptions but can be accelerated to speeds exceeding the star's escape velocity by energetic magnetic-reconnection events in the star's corona. (Thankfully, the Earth's atmosphere and magnetic field shield us from the worst consequences of these phenomena from our own Sun.) Visible-light observations can evaluate sunspots and prominence eruptions near a star's "surface," or chromosphere, but only X-ray measurements of the superheated gas in the corona (a star's outermost "atmosphere") can determine whether the eruption achieves escape velocity.
At 10:41 UT on 23 July, 2023, JAXA's MAXI payload on ISS detected a flare from IM Peg. It was quickly recognized as being a superflare, and NICER began monitoring observations 6 hours later. In addition to capturing the flare's diminishing X-ray brightness over several days, each NICER observation provided a spectrum that enabled measurement of the time-dependent plasma temperature and emission from fluorescing atoms - most prominently, of highly ionized iron. The iron emission is found to be shifted to higher energies than can be explained by the overall plasma properties, suggesting a Doppler shift of iron-containing plasma moving toward us at high speed. The implied velocity is 2200 ± 600 km/s, far exceeding the K-giant star's estimated escape velocity of 230 km/s. The blue-shift is apparent in all data segments from a0 through b3, but is strongest in observation b1. This represents the first direct measurement of outflowing plasma during a stellar flare in excess of a star's escape velocity, with the most likely interpretation being that we witnessed a powerful CME from IM Peg. These results, by S. Inoue (Kyoto Univ., Japan) and collaborators, were accepted this week for peer-revieiwed publication in The Astrophysical Journal.
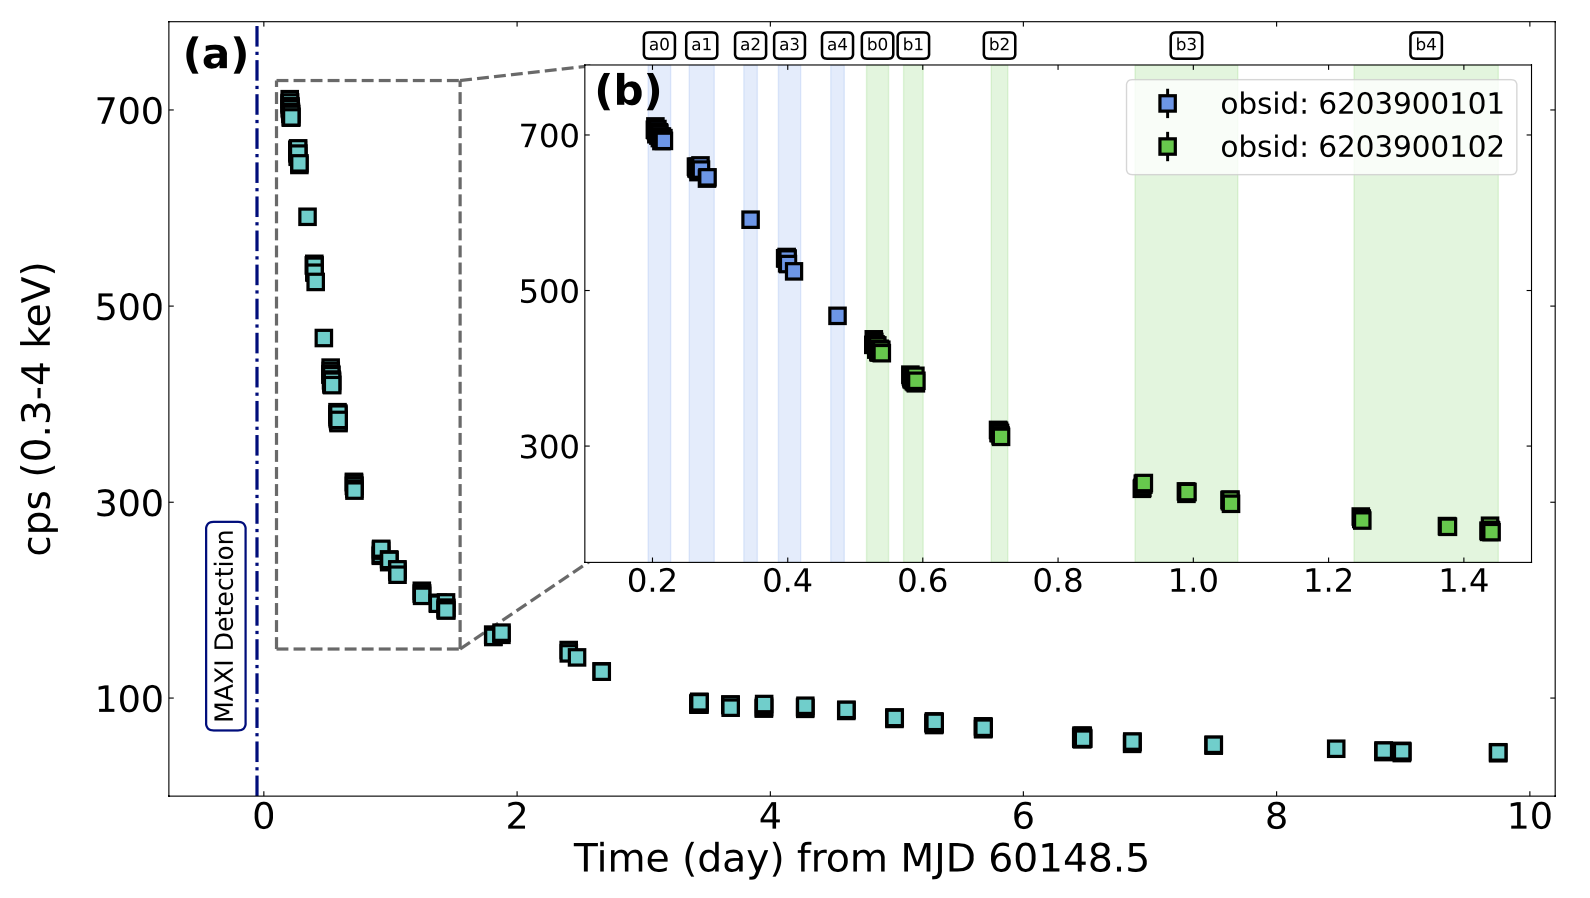
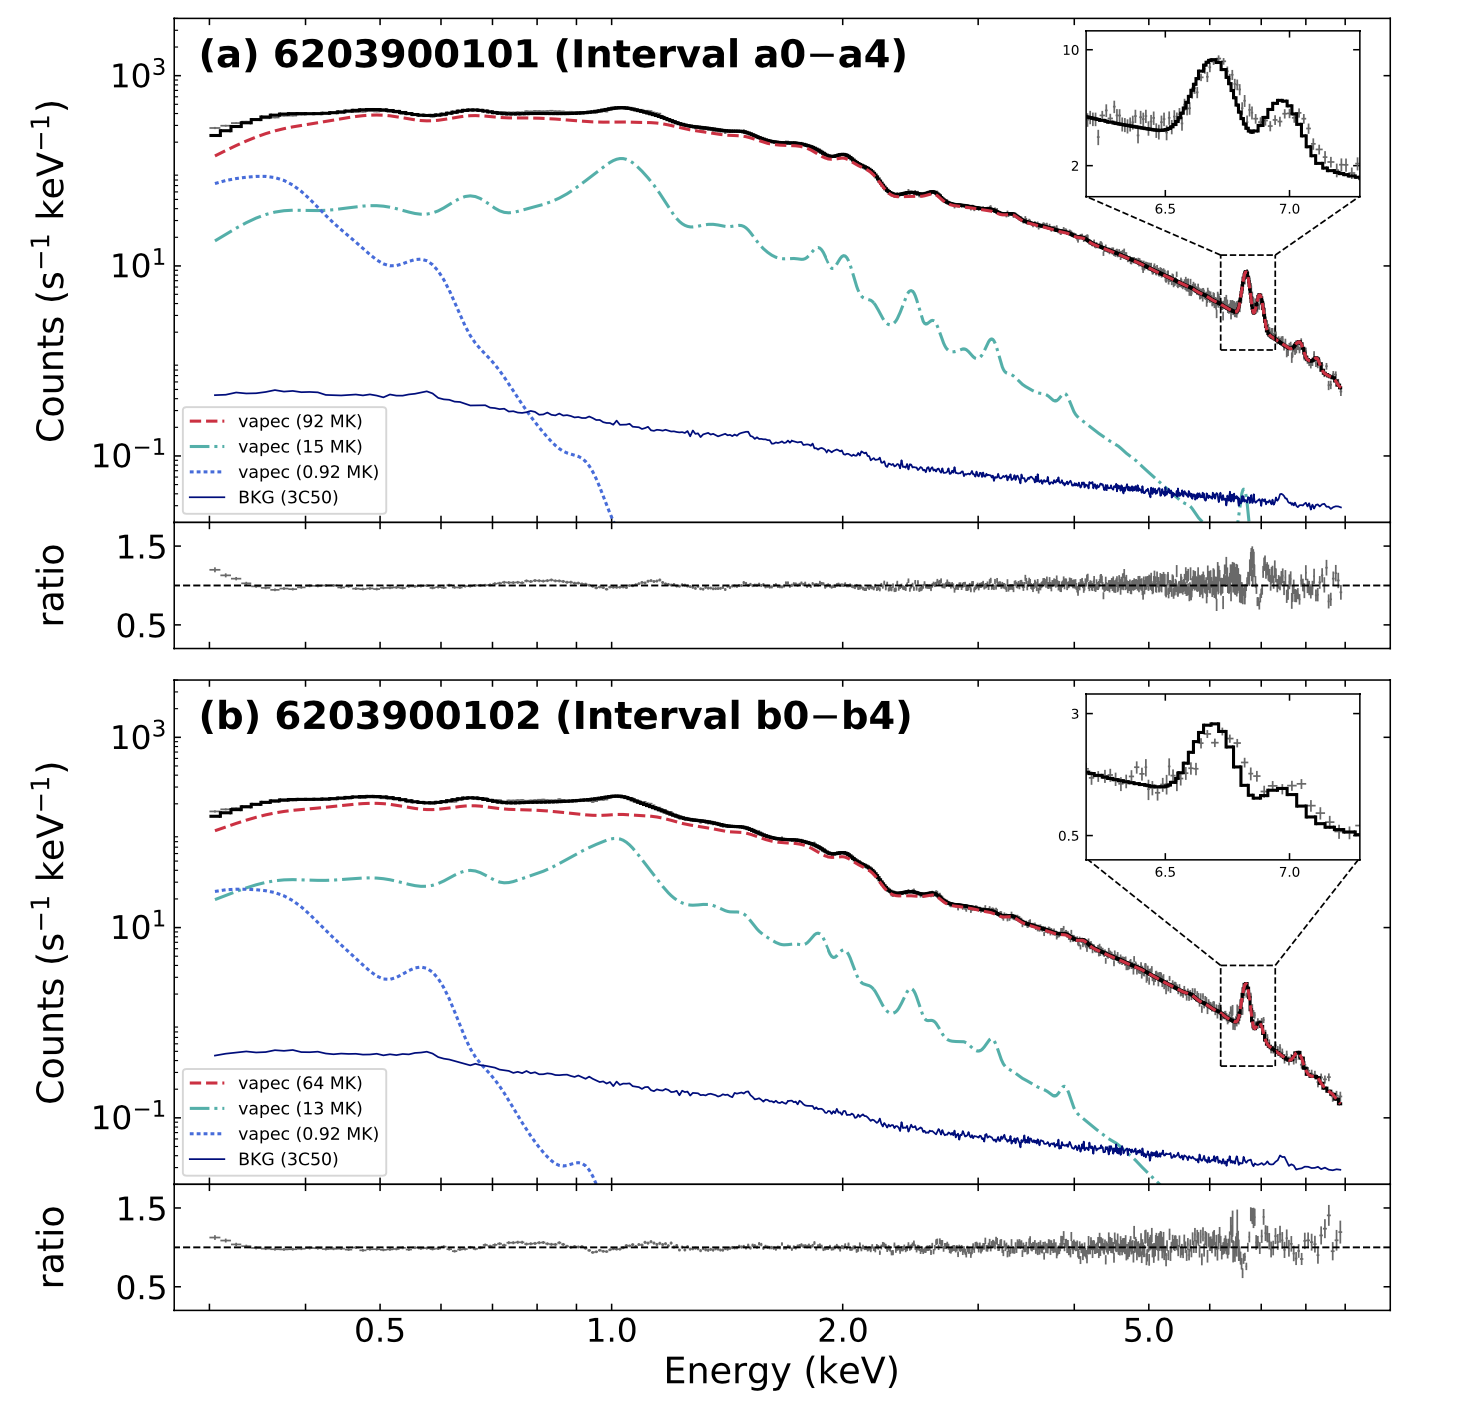
Left: NICER measurements of a fading superflare from the IM Peg binary system. Square points represent the rate of detected X-ray photons in the 0.3 - 4 keV energy band, in bins of 64-sec duration. Time zero is noon UT on 23 July, 2023, and the trigger provided by MAXI is indicated as the vertical dash-dot line at -0.05 days. The inset shows an enlarged view of the first 1.5 days, with daily observations (ObsIDs) indicated by different colors, and reference labels for data acquired during individual ISS orbits (consecutive during the initial part of the decay). Error bars in the X-ray counts per second (cps) measurements are smaller than the plotted symbols. (Credit: Inoue et al. 2024). Right: NICER spectra averaged over the two daily intervals shown in the inset of Fig. 1. The colored traces are: NICER data (solid black), estimated background (solid blue), and best-fit models for plasmas at various temperatures (dashed red, dot-dash green, dotted blue). The fit residuals in the "ratio" panels indicate good fit overall, except in the vicinity of the prominent emission lines of highly-ionized iron atoms between 6.5 and 7 keV (insets), where the measured data show systematic "blueshifts" (i.e., toward higher energies) relative to the underlying models. (Credit: Inoue et al. 2024)
<< Previous
Main Index
Next >>

