Resolve NXB Database and Spectral Extraction Recipes
Overview
This page provides the provisional NXB database of Resolve. It also provides an example of how to prepare the data and run 'rslnxbgen' to extract an NXB spectrum. For this provisional database (and your source), we recommend that users select only Hi-res events and apply screening manually as shown below.
Data Files
The following files are used to extract an NXB spectrum and perform spectral fitting. These files can be found in the Resolve NXB database repository or by following the links provided.
- NXB database covering the period 2023-12-25 to 2026-01-31
- Science data for your source; here we use a public observation of N132, OBSID 000126000, taken with the OPEN filter as an example. Replace that with your data OBSID in the commands below.
- Source event list: xa000126000rsl_p0px1000_cl.evt
- This is located in OBSID/resolve/event_cl in the archive data.
- EHK file: xa000126000.ehk
- This is located in OBSID/auxil in the archive data.
- Other files
The NXB event list was constructed by hand from the Resolve NXB trend repository, selecting suitable observations and applying some additional screening. These events have the same screening as the science event data (see Table 5.1 of the XRISM Data Analysis Guide) with the following exceptions:
- The NXB events are screened differently for Earth elevation (ELV<-5).
- The NXB events are not screened on the distance between the aimpoint and target (ANG_DIST), since the NXB is not a target with defined coordinates.
We recommend additional screening of both the NXB events and science data events in the examples below to ensure that the two datasets are similarly filtered.
Example of Commands to Extract the NXB Spectrum
Extract the source spectrum
We provide an example of extracting a source spectrum here to point out that any filtering applied to the source events must also be applied to the NXB events to ensure consistency. If you have already extracted your source spectrum, you can skip this step, but you must ensure any non-standard event filtering is also applied to the NXB in the section below. Please see the XRISM Data Reduction Guide Section 6 for more information on default and optional Resolve screening criteria.
We first apply the recommended screening to remove pixel-to-pixel coincident events and Ls events:
     ftcopy \
          infile='xa000126000rsl_p0px1000_cl.evt[EVENTS][(PI>=600) &&
	  ((RISE_TIME+0.00075*DERIV_MAX)>46) &&
	  ((RISE_TIME+0.00075*DERIV_MAX)<58) && (ITYPE<4) &&
	  (STATUS[4]==b0)]' \
               outfile='xa000126000rsl_p0px1000_cl2.evt' \
               copyall=yes history=yes
Apply time-based filtering. Prepare a GTI file for the source data, and use it to filter the event list. The CORTIME cut for the source is optional, however you must apply the same cut to the NXB data. The XRISM Resolve team currently recommends using data with CORTIME>=6, so that selection is used here. This will result in the exclusion of some data, and the user is responsible for assessing the effects of different CORTIME filtering on their data and science goals; please see the Additional information below for more information. Note that this filtering can also be performed in Xselect, see the XRISM Data Reduction Guide Section 6 for more information.
    maketime \
        infile='xa000126000.ehk' \
        outfile='ehkSel_src.gti' \
        expr='CORTIME>=6' \
        name=- value=- time=TIME compact=no

    extractor \
        filename='xa000126000rsl_p0px1000_cl2.evt' \
        eventsout='xa000126000rsl_p0px1000_cl3.evt' \
        timefile='ehkSel_src.gti' \
        imgfile=NONE phafile=NONE fitsbinlc=NONE regionfile=NONE \
        xcolf=X ycolf=Y tcol=TIME ecol=PI xcolh=DETX ycolh=DETY

    # Output:
    # ========================================================================
    #    Grand Total      Good    Bad: Time     Phase     Grade       Cut
    #          13620     11462         2158         0         0         0
    #   in 1.04809E+05 seconds
Next extract the source spectrum for the entire array except pixel 27, including only Hp events. This filtering depends on your observation and science goals. In Xselect, run the following commands:
    # Run in Xselect
    read events xa000126000rsl_p0px1000_cl3.evt ./
    filter column "PIXEL=0:26,28:35"
    filter GRADE "0"
    extract events
       # Output:
       # =====================================================================
       #    Grand Total      Good    Bad: Time     Phase     Grade       Cut
       #          11462     11166            0         0        88       208
       #   in 1.04809E+05 seconds
    extract spectrum
    save spectrum src.pi clobber=yes
    set image DET
    extract image
    save image src_det.img clobber=yes
    exit
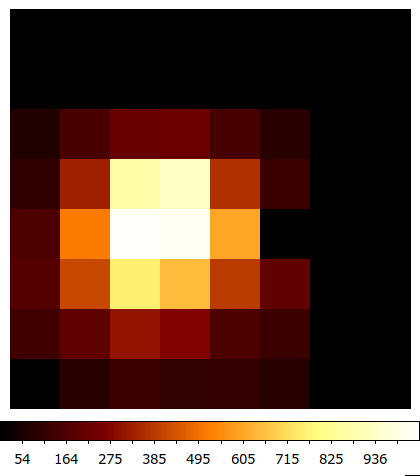
Here is the DET image of the source:
Generate the NXB spectrum
Generate the NXB spectrum for the same region that you used for your science data. Please see the help for 'rslnxbgen' for full details, but here are several things to keep in mind:
- The 'infile' must be the CORTIME-filtered source event list, the same event list used to extract the source spectrum above.
- There is currently a bug in rslnxbgen so that the 'pixels' parameter does not work. As a work-around, use 'pixels=-' and specify the pixel filtering in the 'expr' parameter, as shown in bold in the command below. We use this method to exclude pixel 27 as we did in the source event list above.
- We apply the same screening for Hi-res events and the rise-time-based cuts as we did to the science event list. Note the '(ITYPE==0)' filter in bold, which includes only Hp events. This screening may be done with a separate ftcopy command as for the source data, or using the 'expr' parameter directly in rslnxbgen as we do here.
- There is no explicit CORTIME filtering performed on the NXB events using a maketime or similar command here. Instead, the 'sortbin' parameter of rslnxbgen is used to exclude CORTIME < 6.
- There is currently a bug in rslnxbgen that produces unpredictable results for some values and formats of 'timefirst'and 'timelast'. In addition, we recommend users include the entire existing database regardless of when the observations were taken. The settings below of ±1700 days will accomplish this for any XRISM observation until May 2028. Please use the exact expressions shown in bold below, including minus and plus signs and single quotes, to ensure correct operation.
    rslnxbgen \
         infile='xa000126000rsl_p0px1000_cl3.evt' \
         ehkfile='xa000126000.ehk' \
         regfile='NONE' \
         pixels='-' \
         innxbfile='xrism_nxbdb_v3_rsl.evt' \
         innxbehk='xrism_nxbdb_v3_rsl.ehk' \
         database='LOCAL' db_location='./' \
	 timefirst='-1700' timelast='+1700' \
         sortcol='CORTIME' sortbin='6,8,10,12,99' \
	 expr='(PI>=600) && ((RISE_TIME+0.00075*DERIV_MAX)>46) &&
	 ((RISE_TIME+0.00075*DERIV_MAX)<58) && (ITYPE==0) &&
	 (STATUS[4]==b0) && (PIXEL!=27)' \
         outpifile='rsl_nxb.pi' \
         outnxbfile='rsl_nxb.evt'
We’ll make a DET coordinate image of the NXB data just to compare to the source and make sure the proper pixels are excluded:
ftcopy 'rsl_nxb.evt[EVENTS][bin DETX=1:8:1,DETY=1:8:1]' nxb_det.img clobber=yes

Using the NXB Spectrum
You can compare the generated NXB spectrum with the source spectrum using the Xspec commands below.
    # Run in Xspec
    data 1:1 src.pi
    resp 1 xa000126000rsl_p0px1000.rmf
    data 2:2 rsl_nxb.pi
    resp 2 xrism_nxb_v3_rsl_M.rmf
    setplot device /xw
    setplot energy
    ignore *:**-1.0 12.0-**
    setplot rebin 1000 100 -1
    setplot xlog off
    iplot ld
    rescale y 1e-4 1e-1
    color 2 on 2
    time off
    plot
    hard test-rslnxbgen-N132D_plot.gif/gif
    exit
    exit
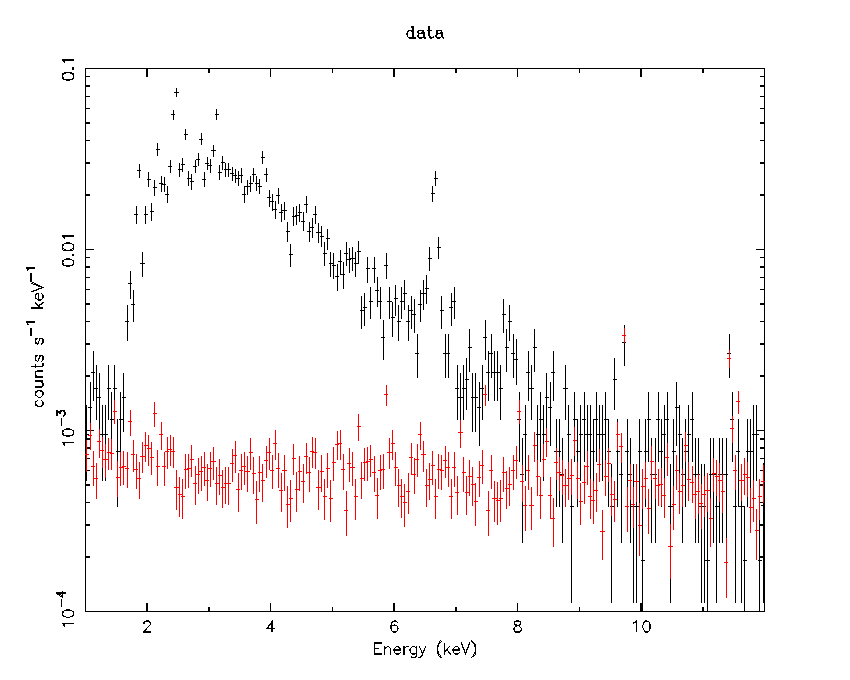
To fit the Resolve NXB spectrum, either on its own or simultaneously with a source spectrum, please see the information about using a Resolve NXB spectral model.
Spatial non-uniformity
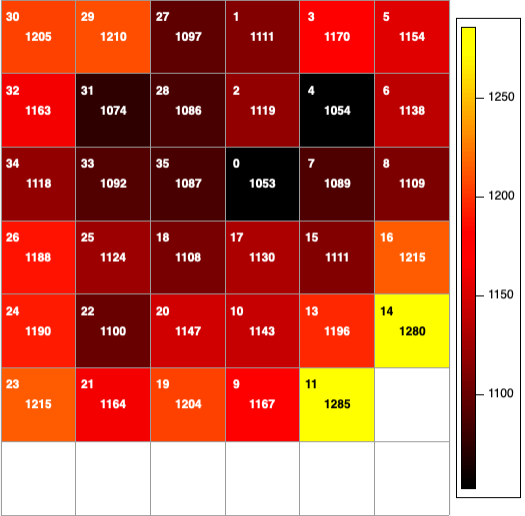
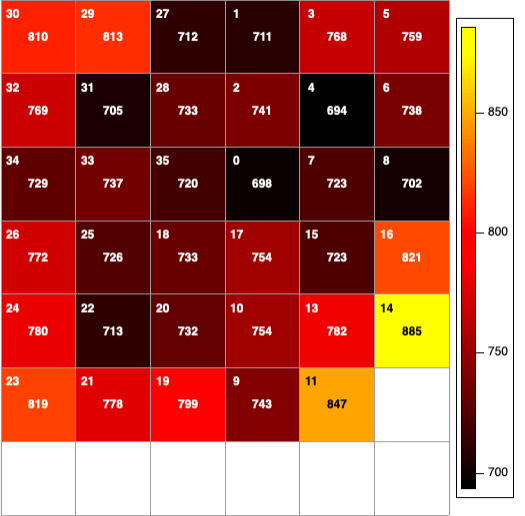
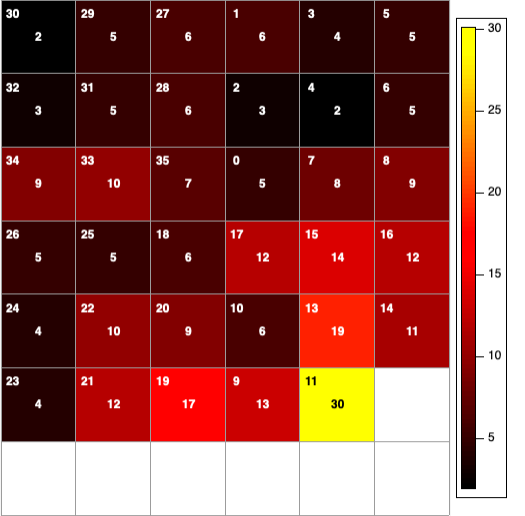
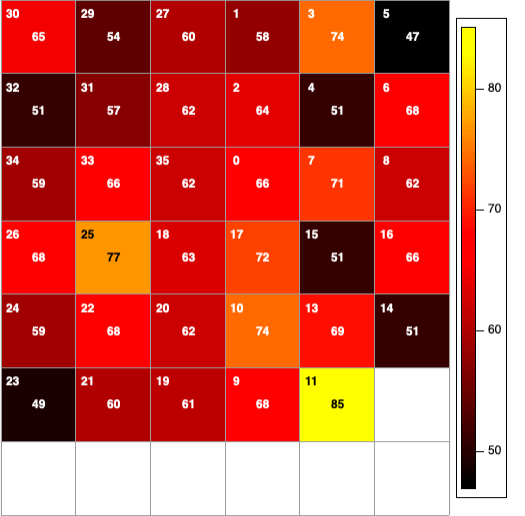
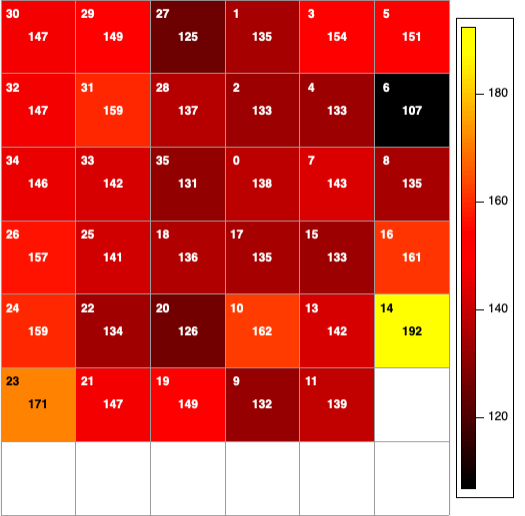
The images below show the spatial uniformity of the v2 Resolve NXB data in various energy bins. The events have been screened as described above, except to increase statistics and complete the array map, no CORTIME filtering was performed and pixel 27 is included. Note that the coordinate system shown here is different from the DET coordinates used in the images above; the pixel number is listed in the upper left corner of each pixel, and the total counts in each pixel is shown in the pixel center and by the pixel color. (From left to right: 1–17 keV, 2–12 keV, Mn Ka (5.880–5.910 keV), Au La and Lb, 3–5 keV (line-free region))
Cut-off rigidity (CORTIME) filtering
The Resolve team recommends excluding times of low cut-off rigidity (specifically CORTIME < 6) because the background level is found to be more variable in these parts of the orbit, as shown in the plots below.
- For the graph below, the Resolve NXB database was divided into CORTIME intervals, and each of these was divided into 15 equal exposures. CORTIME < 6 shows greater absolute (top plot with linear Y axis) and fractional (bottom plot with log Y axis) variation in count rate than the other CORTIME ranges.


- The light curve of screened NXB data below shows intervals that are unusually high. With one exception, these deviations occurred when CORTIME < 6, thus they may be a source of the variability

In the full v3 NXB database filtered as described above and excluding pixel 27, applying a CORTIME >= 6 filter reduces the full-band counts by 17.6% (12,088 out of 68,826 counts removed) and the exposure time by 9.5% (383 ks out of 4046 ks). This gives an idea of the effect of applying this filter, however the following caveats must be kept in mind:
- The exposure fraction occurring during CORTIME < 6 could be more or less than this in a given observation, depending on where in the orbit the eclipses occur.
- Variability in the NXB at low CORTIME occurs on a number of different timescales, and by definition the Good Time Intervals of the science observation and NXB do not overlap. Therefore it is not sufficient to look at the NXB light curve around the observation and conclude that you may use CORTIME < 6 because the NXB is stable; the science observation samples a different portion of the orbit and may be affected differently.
- If the user is concerned about the loss of exposure from performing this cut, they should investigate the effect on their observation’s signal-to-noise with and without the cut.
The user is responsible for assessing the effects of various CORTIME cuts, as these depend sensitively on several factors, including the brightness of the object under study, the energy band used, and the particular science goals of the analysis.