NICER / ISS Science Nugget
for July 25, 2024
Modeling a wobbly disk
A high-profile NICER paper published in May in the journal Nature described recurring X-ray flares over roughly 120 days from a tidal disruption event (TDE), the shredding of a star that ventured too close to a million-solar-mass black hole at the heart of a distant galaxy. The flaring behavior was proposed to be the signature of a disk of gas - the remains of the unlucky star - gradually aligning its orbital angular momentum with the black hole's spin axis through a relativistic "wobble," or precession. A new peer-reviewed paper, published this week in The Astrophysical Journal by Z. Cao (Netherlands Inst. for Space Research) and collaborators, offers a detailed spectroscopic analysis of the NICER data, extending to more than 1,000 observations over nearly 18 months from the star's disruption, detected by ground-based telescopes as a visible-light transient in April 2020.
Cao et al. adopt a "slim disk" model to describe NICER's low-energy (soft) X-ray spectra, suitable for high rates of mass accretion onto the black hole and distinct from "thin disk" models for low accretion rates; they also include a higher-energy component due to soft photons from the disk boosted in energy by scattering in a hot electron cloud, a common feature of accreting systems. Their physical model takes into account, among other factors, the inclination of the disk's plane relative to our line of sight, and the evaluation of hundreds of individual NICER spectra probes the time-dependence of the model's physical elements. The authors demonstrate good model fits to the vast majority of the individual NICER spectra, as well as three measurements made (two in the early phase and one later) with ESA's XMM-Newton telescope. Notably, Cao et al. find robust evidence for changes, associated with the recurring flares, in both the disk inclination and the amount of photon energy boosting, showing that the spectral behavior - not just the flaring alone - is consistent with the hypothesis of relativistic precession of an accretion disk formed by the remains of a disrupted star.
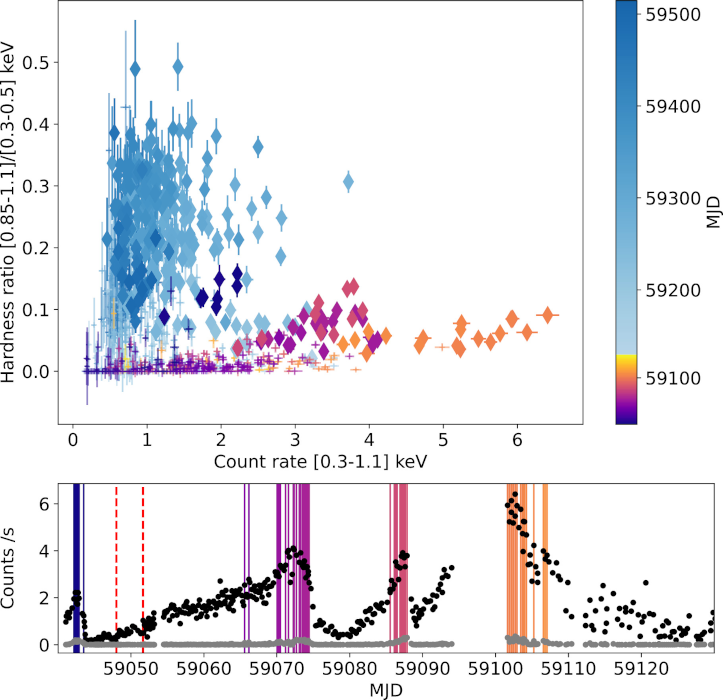
Left: The lower panel shows NICER photon detections, in counts per second, for the first 100 days following discovery of the transient AT2020ocn, a likely tidal disruption event; black points represent the 0.3-1.1 keV photon energy band while gray points indicate just the high-energy portion from 0.85 to 1.1 keV. The dashed red vertical lines show the times of two observations made with the XMM-Newton observatory. Solid vertical lines, corresponding to the color scheme of the upper panel, indicate the dates of the highest-quality data during the flares, and which are plotted in the upper panel with diamonds. The upper panel shows the ratio of photon detection rates in the high- vs. low-energy ranges as shown in the axis label; colors reflect changes with time in Modified Julian Day (59130 is Oct. 8, 2020). A distinct break in the spectra is seen between the flaring period, the first ~100 days, and later, when the X-ray emission hardens. (Credit: Cao et al. 2024)
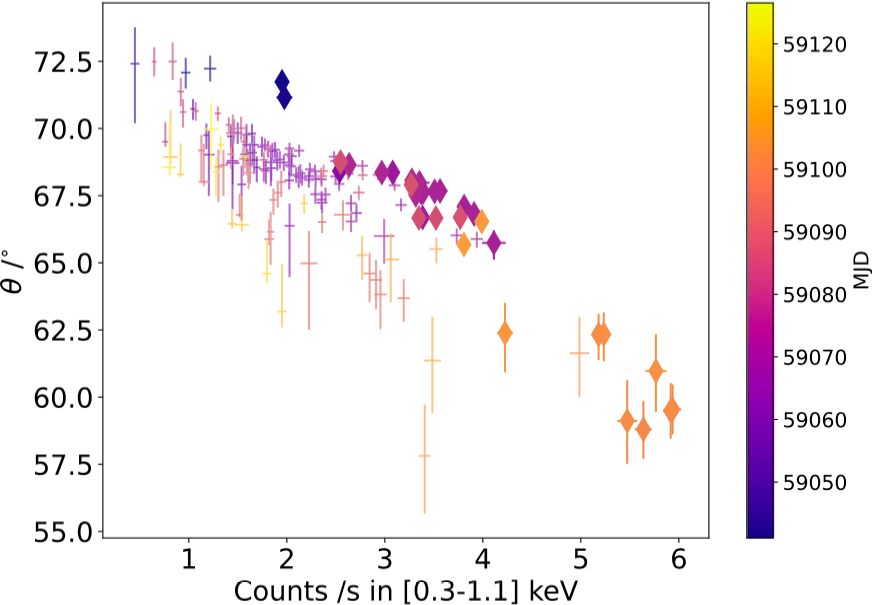
Right: Using the same color scheme and label styles (diamonds for high signal-to-noise data), the evolution of a slim-disk model's inclination relative to our line of sight is shown as a function of the measured NICER photon detection rate. In general, and more pronounced during flares (diamonds), the disk is less inclined - i.e., more edge-on - when the source is dimmer, which is expected: we see the hotter, brighter central portions of the disk when it is more face-on. (Credit: Cao et al. 2024)
<< Previous
Main Index

